Population shifts have become a factor across the country as the pandemic made remote work more common and a new report asserts that New Jersey has not fared well during the COVID years.
San Diego-based HireAHelper’s recently released their 4th Annual Migration Report analyzing the 90,000 local and long-distance moves that were booked through the company last year. The study also weighted two customer surveys plus statistics from the U.S. Census Bureau to determine net gains and losses in population for both states and cities across America.

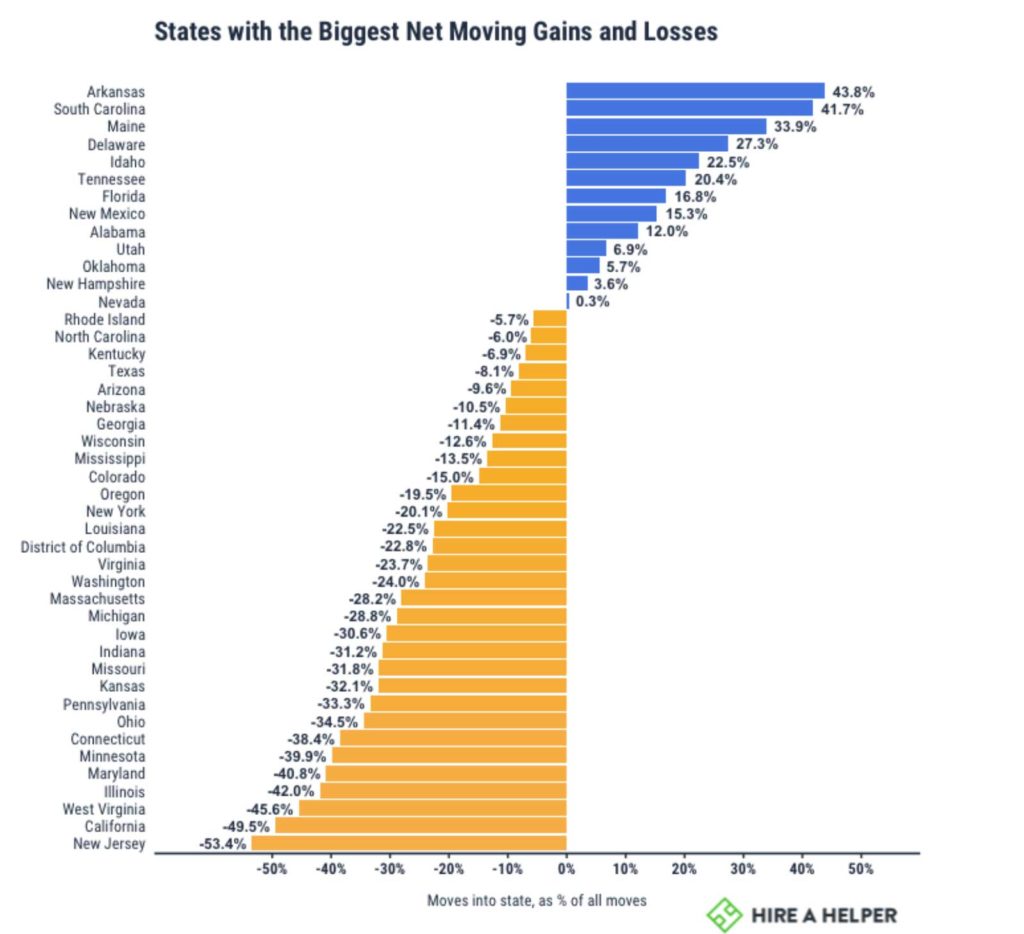
Despite New Jersey adding significant housing in its urban centers in recent years, the study’s data showed the Garden State with a net population loss of 54% over the last year, meaning that more people moved out than in. New Jersey’s “top” ranking was followed by second-place California (-49%) and West Virginia (-45.6) at #3, with Illinois (-42.0%) and Maryland (-40.8%) rounding out the top five.
In a case of déjà vu, a 2020 study from United Van Lines also claimed that New Jersey had the most outbound moves in the country. You would think that the traffic conditions would improve as a result, but we digress.
So where are HireAHelper’s customers flocking to? Arkansas at +44%, topped the study’s net move-in population gain and was followed by South Carolina (+42%), Maine (+34%) and Delaware (+27%).

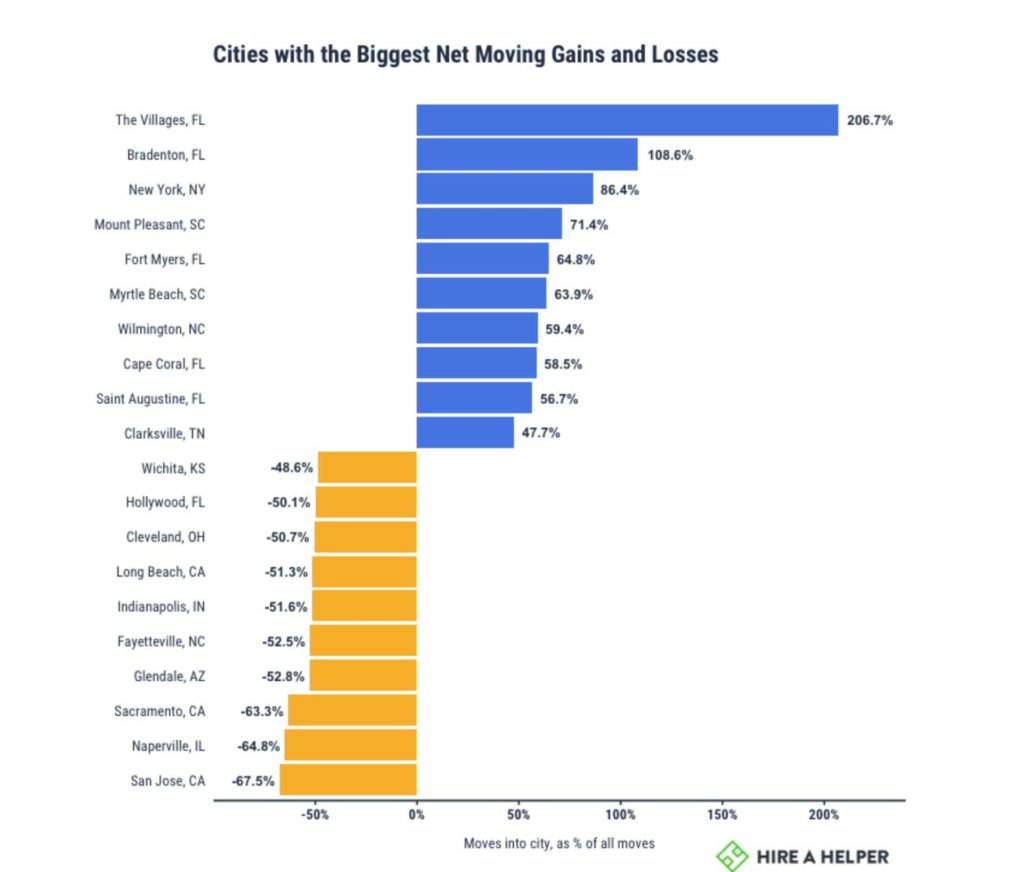
The survey did contain some good news for New Jersey in terms of the state’s second-largest municipality. Jersey City saw a 9.3% net move-in rate, which ranked them 34th nationwide among cities. Likely due to the arrival of all those New York City expats, we assume.
In absolute terms, the study found Florida (5.8%), Texas (4.8%), and California (3.2%) saw the greatest share of all moves inward and outward last year. But 2021 was a surprisingly low year for mobility; the report claims about 26.4 million Americans moved over the course of the year, representing only 8% of the population and totaling the lowest annual percentage of people moving ever recorded.